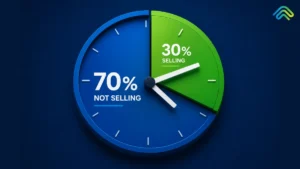
20–30% of revenue doesn’t disappear because your pipeline is thin. It slips away after the buyer has already signaled. Here’s what revenue leakage actually means in 2026 and how to stop it at its source.
Picture a deal your team worked hard to move forward. The prospect opened your proposal four times in a 48-hour window. Your platform flagged the intent signal. The CRM note was logged. Someone was going to follow up, right after the next internal sync.
Three days passed. The buyer went quiet. Then the email arrived: they’d signed with someone else.
That’s not pipeline failure. That’s revenue leakage and it’s one of the most misunderstood, most expensive problems in B2B sales today.
The conventional wisdom says revenue leakage is about billing errors, pricing inconsistencies, and missed invoices. And those things are real. But in 2026, the far larger and far more costly form of leakage happens somewhere else entirely: in the gap between a buyer signal and the action that was supposed to follow it.
This piece is about that gap, what causes it, how to diagnose it and how to close it permanently.
What Is Revenue Leakage? A Definition That Actually Fits 2026
Revenue leakage is the difference between the revenue a business should capture and the revenue it actually collects. It’s not because demand was absent, but because execution failed after the signal was present.
That’s a deliberately different definition from the one you’ll find in most RevOps glossaries. The traditional revenue leakage definition focuses on back-office breakdowns: a discount that shouldn’t have been applied, a contract that renewed at the wrong tier, a service that was delivered but never invoiced. Those are real problems, and they deserve attention. But they describe a shrinking fraction of total leakage.
The bigger story, the one that most organizations haven’t fully reckoned with — is this: buyers are generating more signals than ever. Intent data, engagement analytics, deal activity, usage patterns, buying committee movements. The signal infrastructure has never been richer.
And yet revenue still leaks. Not because we can’t see the signals. Because the actions that should follow those signals aren’t consistent, aren’t fast and aren’t accountable.
| Insight ≠ Revenue. Revenue Execution = Revenue. The moment a signal fires without a corresponding action, you’ve already started leaking. |
There’s a name for this gap between signal and action. We call it signal-to-action latency. And in our experience working with B2B revenue teams, it’s the single largest driver of slipped revenue that almost nobody is directly measuring.
| 20–30% of potential revenue leaks post-buyer interaction, not from pipeline weakness, but from execution gaps that occur after signals are already present. (SpurIQ Revenue Execution Research) |
Also Read: Revenue Intelligence vs Revenue Execution: Why Insights Don’t Close Deals
Revenue Leakage Examples: What It Actually Looks Like?
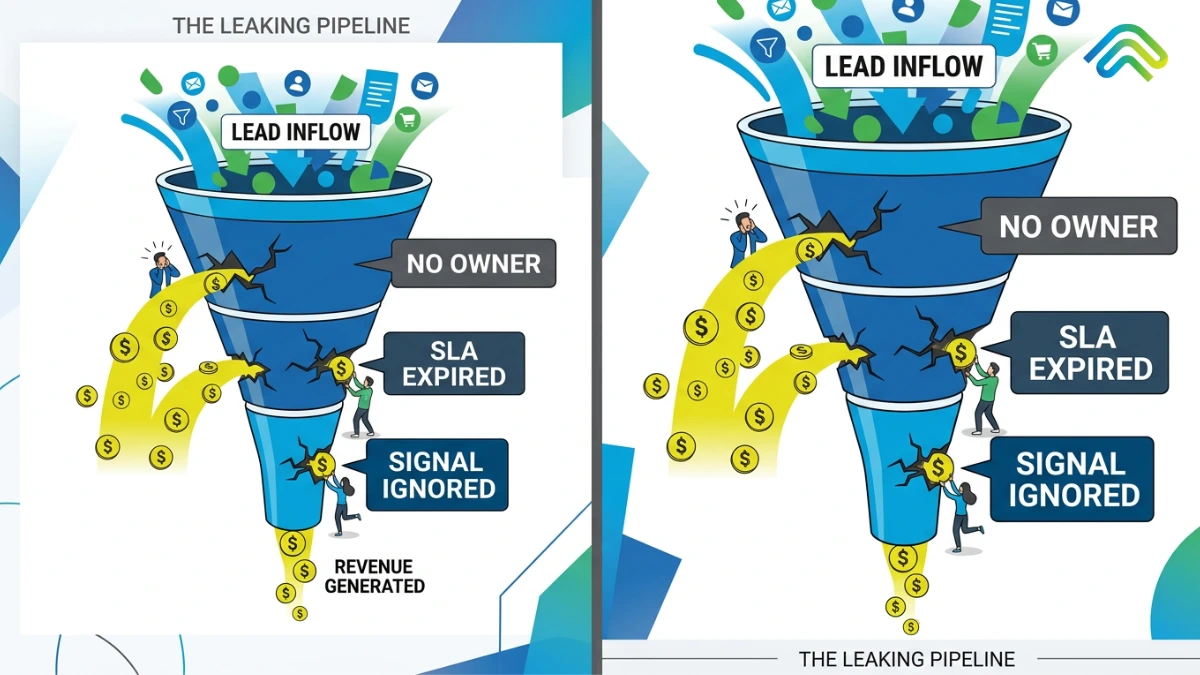
Revenue leakage doesn’t usually look dramatic. It rarely shows up as a single catastrophic event. It shows up as a collection of small, preventable moments, each one a signal that existed and an action that didn’t follow.
Here are five examples that illustrate the full picture, from the traditional to the execution-gap scenarios that define leakage in the modern revenue environment.
1. The Prospect Who Was Ready and Then Wasn’t
A mid-market prospect spends two days re-opening your proposal, forwarding it internally, and visiting your pricing page three times. Every signal says this is a high-probability, near-close deal. The rep who owns the account is in back-to-back meetings. The alert sits in a dashboard. No follow-up fires automatically.
By day four, the prospect has moved on, not because they lost interest, but because your competitor responded faster. The signal was there. The execution was not. That’s revenue leakage.
2. The Champion Who Moved On and Nobody Noticed
Your internal champion at a key account accepts a new job. LinkedIn shows the move on the day it happens. Your CRM reflects it two weeks later, when someone manually updates the contact. By then, no re-engagement sequence has fired. The relationship has gone cold. The renewal is at risk.
This is a signal-to-action gap measured in weeks, not hours. In a market where champions carry institutional relationships with them, that latency is often fatal to the deal.
3. The Renewal That Wasn’t Saved
A long-standing customer’s usage data drops 30% over six weeks. Every customer success playbook says this pattern predicts churn. But the signal sits in a health dashboard. The CSM has sixteen other accounts. No automated outreach fires. The customer churns at renewal.
This is bottom-of-funnel revenue leakage. The signal was rich. The execution ownership was absent.
4. The Discount That Didn’t Need to Happen
A rep, trying to accelerate a deal close before quarter-end, applies a 15% discount without finance approval. The deal closes, but at an eroded margin. No workflow flagged the deviation. No approval path enforced the pricing governance.
This is the classic example of revenue leakage and it’s real. But notice something: it, too, is an execution gap. The process existed. The enforcement of it did not.
5. The Hot Lead That Arrived at the Wrong Desk
An inbound lead scores 94 out of 100 on your ICP model. It routes to an SDR who is already at capacity. The lead sits for 72 hours before first contact. By the time someone reaches out, the buyer has already spoken to two competitors.
Signal-to-action latency at the top of the funnel. The lead was as warm as it gets. The routing and response execution failed.
| The Pattern Across All Five Examples: In every case, the revenue signal was present. Intent data. Engagement signals. Usage drops. Champion changes. ICP scores. The leak didn’t happen because the signal didn’t exist, it happened because no accountable, automated action followed the signal with sufficient speed. |
Why Revenue Leakage Is Getting Worse, Not Better?
If you’d asked a revenue leader about leakage 5 years ago, the answer would have been about data quality, billing systems and contract management. Those are still valid concerns. But the dominant driver has shifted.
Here’s what changed:
Signal volume has exploded. Execution resources haven’t
Intent data platforms, engagement analytics, CRM activity tracking, buying committee intelligence, the average B2B revenue team now has access to ten times more buyer signals than they did in 2019. But the number of reps, CSMs, and RevOps team members hasn’t scaled proportionally.
More signals without more execution capacity doesn’t mean more revenue. It means more leakage. Dashboards fill up with alerts that nobody has time to act on. Intent data becomes noise. Revenue slips.
Buyer patience has collapsed
The window between a buyer signal and a meaningful competitive response has narrowed dramatically. Research consistently shows that response time is one of the highest-leverage variables in B2B sales conversion. In 2026, a 48-hour delay on a high-intent signal isn’t a minor inconvenience, it’s often a deal-ender.
Signal-to-action latency that felt manageable in 2021 is fatal today.
RevOps built for visibility, not execution
The last decade of RevOps investment was largely about building better dashboards. Better pipeline visibility. More accurate forecasting. Richer data. These are genuine improvements and they’ve helped revenue leaders understand their funnels far more clearly.
But visibility doesn’t capture revenue. Execution does. And most organizations have invested heavily in the former while treating the latter as a human problem to be solved by rep motivation and manager oversight.
It isn’t a human problem. It’s a systems problem.
| 45% of senior executives believe revenue leakage is a systematic problem at their companies not an occasional one. (Boston Consulting Group) |
Revenue Leakage Analysis: How to Find Where Revenue Is Slipping?
Before you can fix revenue leakage, you need to know precisely where it’s happening and why. A proper revenue leakage analysis isn’t a spreadsheet exercise or a RevOps audit. It’s a structured diagnostic of your execution system, mapping signals against actions and measuring the latency and accountability gaps between them.
Here’s a four-step framework for doing that:
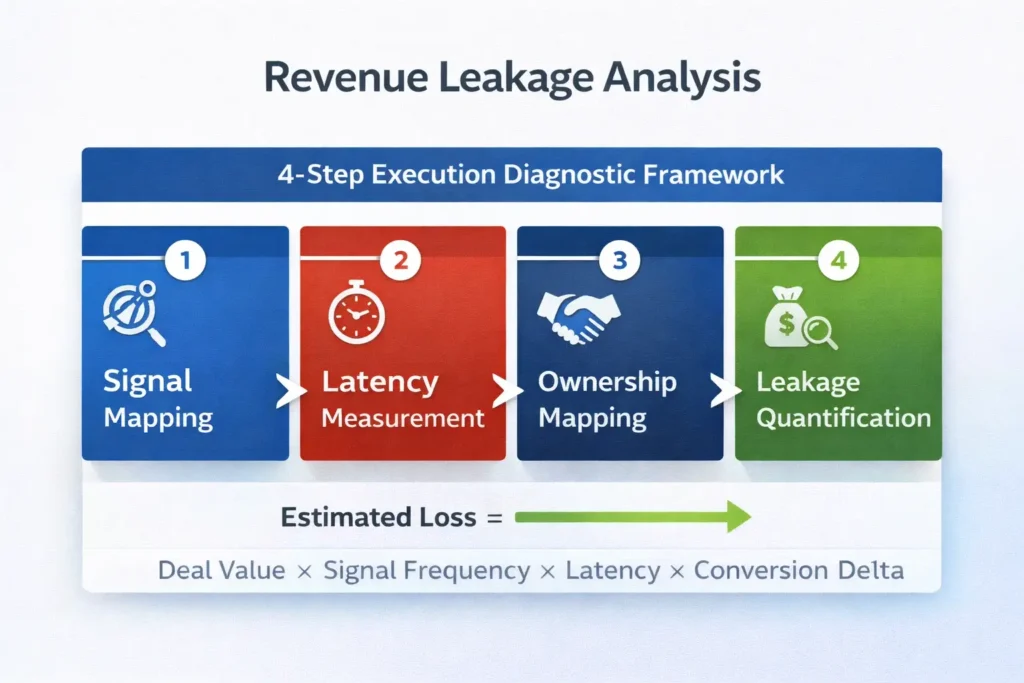
Step 1: Map your signal sources
Start by cataloguing every meaningful revenue signal your organization has access to: inbound lead scores, intent data from third-party platforms, CRM engagement activity, deal health scores, champion changes, product usage data, contract renewal timelines.
For each signal type, ask: Is this signal being captured consistently? Is it visible to the right person? And crucially, what is supposed to happen next when this signal fires?
Most organizations find that their signal catalogue is far richer than their response infrastructure suggests. The signals exist. The action paths are incomplete.
Step 2: Measure signal-to-action latency
For every signal type you’ve mapped, measure the average time between the signal firing and a meaningful action following it. Not the time until someone is notified, the time until someone actually does something.
High-priority signals should be measured in hours. If your analysis shows average latency of 48–72 hours on high-intent signals, you’re looking at a significant source of revenue leakage. Best-in-class execution teams respond to their most valuable signals in under four hours, often automatically.
Map this latency by funnel stage, top-of-funnel routing and response, mid-funnel deal progression, bottom-funnel renewal and expansion. Leakage tends to concentrate at specific stages rather than spreading uniformly across the funnel.
Step 3: Identify execution ownership gaps
For each signal type, who specifically owns the response action? Is that ownership documented, enforced by a system, or merely assumed?
This is where most organizations surface their deepest leakage. When the answer to ‘who owns this?‘ is ‘it depends on the rep‘ or ‘it goes through the manager‘ or ‘whoever has capacity‘ — you have an execution ownership gap. Implicit ownership is a revenue leak waiting to happen.
Pay particular attention to handoff points: SDR to AE, AE to CSM, CSM to renewal. These transitions are where signal context gets lost and accountability evaporates.
Step 4: Put a dollar figure on it
Rough as it may be, quantifying the leakage transforms it from a qualitative concern to an executive priority. Multiply average deal value by signal frequency by average action latency by estimated conversion rate delta for high-latency versus low-latency responses.
For a company with $50M in ARR, a 20% execution-related leakage estimate represents $10 million in revenue that was already in the system — as a signal — but slipped before execution could capture it. That number, when presented to a CEO or CFO, reframes the entire conversation from ‘how do we fill more pipeline?’ to ‘how do we execute on the pipeline we already have?’
The Root Causes of Revenue Leakage (Both Old and New)
It’s worth being honest about both categories of cause, the traditional ones that remain relevant, and the execution-gap causes that are driving the majority of leakage in modern revenue organizations.
The traditional causes (don’t ignore these)
Billing errors. Pricing inconsistencies. Unauthorized discounts. Missed contract renewals. Services delivered but not invoiced. These are real, they compound over time, and they deserve systematic attention through governance, automation and financial controls.
If your organization has significant exposure in these areas, particularly if you operate complex pricing structures, high-volume subscriptions, or project-based billing. In these cases, you should absolutely have dedicated systems addressing them.
But here’s the reframe: even these traditional causes are, at their core, execution failures. A discount gets applied without approval because no system enforced the approval path. An invoice gets missed because no workflow tracked the service to the billing event. The problem isn’t just the error itself, it’s the absence of execution infrastructure that would have prevented it.
The execution-gap causes (these are where most leakage hides today)
Signal-to-action latency sits at the top of the list. The longer the gap between a revenue signal and the action that follows it, the higher the probability that the opportunity decays before it’s captured.
Disconnected execution ownership means that even when signals are visible, no system ensures a specific person or automated process is accountable for the response. Accountability that’s implicit isn’t accountability at all.
Alert fatigue without orchestration is the shadow side of the data-rich modern sales environment. When every signal generates a notification but no signal generates an automatic response, reps develop a learned indifference to the alerts. The signal becomes noise.
Fragmented handoffs let context evaporate between funnel stages. The SDR knows things about a prospect that never makes it to the AE. The AE understands nuances about a customer that never reaches the CSM. Without orchestration at handoff points, execution gaps are structurally guaranteed.
Finally, insight without action is the meta-problem underlying all of the above. Most revenue organizations have more insight than they can act on. Dashboards, reports, forecasts, health scores. The investment in visibility has not been matched by investment in execution infrastructure.
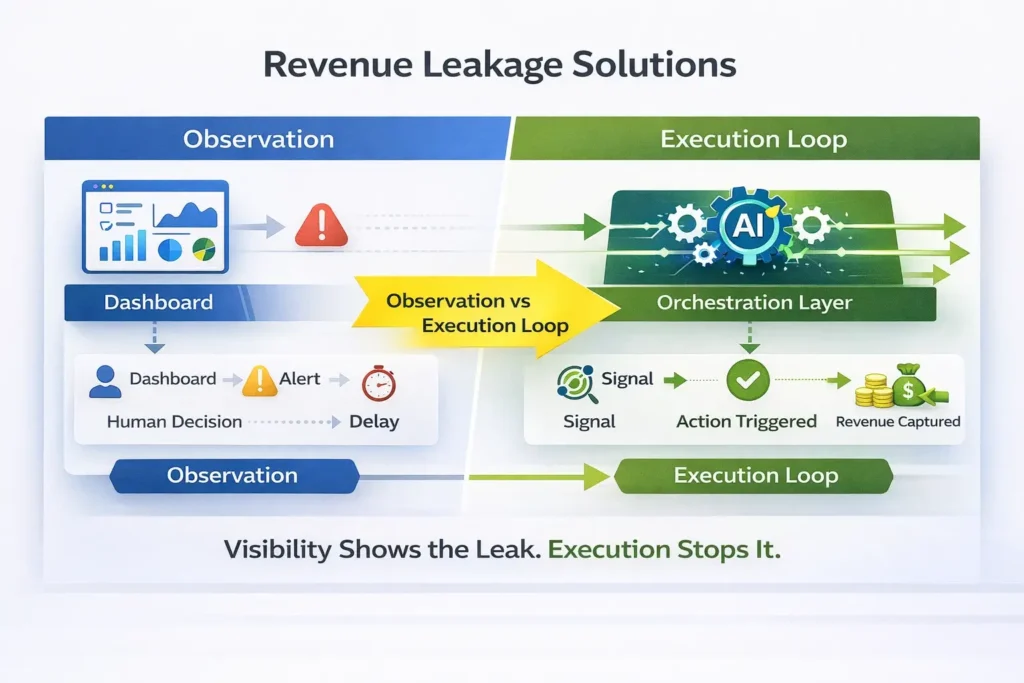
| The question isn’t ‘Can we see where revenue is leaking?’ Most teams can. The question is ‘Do we have a system that automatically closes the gap when a signal fires?’ Most teams don’t. |
How to Prevent Revenue Leakage: SpurIQ’s AI Revenue Action Orchestration Framework
Preventing revenue leakage in 2026 is not a process improvement problem. It is not solved by a new dashboard, a tighter SLA, or a revised sales playbook pinned to a Notion page. Those approaches treat execution as a human discipline problem. They fail because the volume, speed and complexity of modern revenue signals have exceeded what human attention can reliably manage.
The solution is architectural. It requires moving from a passive visibility model to an active execution model — a system that doesn’t wait for a rep to notice a signal and decide to act, but one that automatically converts every meaningful revenue signal into an orchestrated, accountable action the moment it fires.
This is what SpurIQ’s AI Revenue Action Orchestration is built to do. Not to surface more alerts. Not to build better reports. To own execution across the funnel.
| The Execution Gap: Why Your Stack Is Failing You Most B2B revenue stacks are built in two disconnected halves: Signal Side: Intent platforms (6sense, Bombora), CRM data (Salesforce, HubSpot), product telemetry, engagement data (Outreach, Salesloft), CS health scores. Action Side: Reps. Managers. CSMs. Human judgment operating on manual schedules with competing priorities and finite bandwidth. The gap between them, where signals fire but no accountable action follows, is where 20–30% of your revenue disappears. SpurIQ sits in this gap. Not as another analytics layer. As the execution owner that bridges signal to action, automatically. |
The Four-Stage AI Revenue Action Orchestration Architecture:
SpurIQ’s execution model operates across four distinct stages. Each stage is purpose-built to eliminate a specific class of execution gap. Together, they form a closed-loop system, from raw signal ingestion to confirmed, outcome-tracked action.
| 01. AGGREGATE | Signal Aggregation: One Nervous System Across Your Entire Stack SpurIQ acts as a central signal aggregation layer, ingesting revenue data in real time from every system in your GTM stack — intent platforms (6sense, Bombora, G2), CRM activity (Salesforce, HubSpot), engagement sequences (Outreach, Salesloft, Apollo), product telemetry, CS health data, and buying committee intelligence. No signal lives in a silo. Every data point flows into a unified execution context. |
↓
| 02. INTELLIGENCE | AI Revenue Intelligence: From Data to Prioritized Action Signal Raw signals don’t execute. Prioritized, contextualized signals do. SpurIQ’s AI intelligence layer applies machine learning to the aggregated signal pool — evaluating buying probability, churn risk, expansion likelihood, and competitive displacement indicators. It filters alert noise from genuine execution triggers, scores signals by urgency and deal impact, and surfaces only what requires action. The output is not a dashboard of things to think about. It is a ranked queue of execution triggers, each with a recommended response play attached. |
↓
| 03. ORCHESTRATE | Automated Revenue Action Orchestration: The Engine of ExecutionThis is where SpurIQ’s differentiation becomes concrete. When the AI intelligence layer identifies an execution trigger, the orchestration engine doesn’t send a notification. It executes a coordinated, multi-system action play, automatically, without rep intervention, in the time it takes most teams to finish reading the alert email. |
What orchestration looks like in practice, when a Tier 1 account crosses the intent threshold:
| Example: Tier 1 Intent Spike Orchestration Play (SpurIQ Lead IQ) Signal Received: Tier 1 ICP account visits pricing page + views technical documentation + two contacts identified as buying committee members. SpurIQ Executes Simultaneously: 1. Routes lead to the highest-availability AE matching the account’s industry and deal size profile — not the next rep in a round-robin queue. 2. Triggers a personalized, contextual outreach sequence in Outreach/Salesloft — referenced to the specific pages viewed. 3. Pauses generic marketing drip for the account — replacing it with deal-stage-appropriate content. 4. Creates a timestamped task in Salesforce with full signal context attached. 5. Sends a Slack alert to the assigned AE and their manager with the full account context, suggested talk track, and response deadline.Time from signal to first action: under 60 seconds. |
Compare that to the standard operating model: signal fires, lands in a digest email, rep skims it three hours later, logs a task, calls two days after that. The buyer is already in a competitor’s demo.
Orchestration is not automation in the narrow sense, ‘if form filled, send email.‘ It is cross-system, cross-role, outcome-driven execution. When a single signal fires, SpurIQ coordinates actions across your CRM, your sequencing tool, your marketing platform, your communication channels, and your management reporting layer, simultaneously.
| Example: Mid-Funnel Deal Stagnation Orchestration (SpurIQ Deal IQ) Signal Received: ‘Proposal Sent’ deal has had no CRM activity for 12 days. Stakeholder engagement score dropping. No multi-thread activity detected. SpurIQ Deal IQ Executes: 6. Flags deal as ‘Execution Risk’ in Salesforce and updates deal health score — visible to manager without manual reporting. 7. Triggers ‘Stalled Deal Recovery Play’ — a targeted re-engagement sequence referenced to the specific proposal content. 8. Activates marketing air-cover — sends case study and ROI calculator to all identified buying committee contacts. 9. Escalates to Sales Manager via Slack if no rep action occurs within 24 hours. Without Deal IQ: this deal becomes a QBR talking point. With Deal IQ: it becomes a recovery. |
↓
| 04. CLOSE THE LOOP | Closed-Loop Accountability: The System Watches the Watcher Orchestration without accountability is just sophisticated automation. The fourth stage is what makes SpurIQ an execution system rather than an execution tool. For every triggered action, SpurIQ tracks whether the action was completed, when it was completed, and what the outcome was. If a high-priority execution trigger goes unaddressed past a defined threshold, the system doesn’t log the miss — it escalates. Automatically. To the right manager. With the full context attached. |
This is closed-loop execution. The signal fired. The action was triggered. The outcome was tracked. If the loop broke, if the rep didn’t act, if the sequence didn’t convert, if the play failed, the system identifies the leakage point and triggers an intervention.
Most revenue tech stops at alerting. SpurIQ closes the loop at accountability. That distinction is the difference between a system that tells you revenue leaked and a system that prevented it from leaking in the first place.
SpurIQ’s Execution Owners: Lead IQ and Deal IQ
SpurIQ’s orchestration architecture is deployed through two purpose-built execution modules, each owning a specific segment of the revenue funnel.
| Capability | Lead IQ (Top-of-Funnel) | Deal IQ (Mid & Bottom-of-Funnel) |
| Execution Scope | Signal to first meaningful engagement | Proposal through close, renewal, expansion |
| Primary Signals | Intent spikes, ICP triggers, inbound form fills, pricing page visits | Deal stagnation, stakeholder disengagement, usage drops, champion changes |
| Orchestration Actions | Smart routing, outreach sequencing, marketing drip suppression, SDR task creation | Recovery plays, multi-thread activation, manager escalation, CS intervention triggers |
| Latency Standard | < 60 seconds from signal to first action | < 4 hours from signal to active play |
| Accountability Layer | Rep response tracking, routing audit trail | Deal health scoring, escalation logging, outcome attribution |
Why Standard Workflow Automation Is Not Revenue Orchestration?
A common misunderstanding is that existing automation tools — marketing automation, CRM workflow rules, sequencing if/then logic — already do what Revenue Action Orchestration does. They don’t. The difference is architectural:
| Dimension | Standard Workflow Automation | SpurIQ AI Revenue Orchestration |
| Logic | Linear: If X happens, do Y. | Conditional, multi-signal: If X AND Z happen AND deal score drops, execute coordinated Play across 4 systems. |
| Scope | Single channel, single system. | Cross-system, cross-role — CRM + sequencer + marketing + Slack + management layer simultaneously. |
| Intelligence | Rule-based, static. | AI-evaluated, dynamic — signal prioritization adjusts based on deal context and historical outcomes. |
| Accountability | Logs that a workflow ran. | Tracks whether the action achieved its intended outcome. Escalates if it didn’t. |
| Execution Ownership | Executes a task. Ownership unclear. | Assigns explicit accountability to a named owner. Escalates up the management chain if unresolved. |
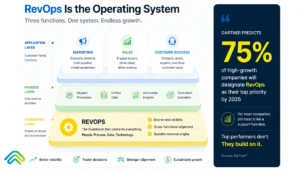
Revenue Execution vs. Revenue Operations: A Critical Distinction
A common objection from revenue leaders: ‘We have a RevOps team. Isn’t this already covered?‘ This is a category error that’s worth addressing directly.
| Revenue Operations (RevOps) | SpurIQ Revenue Execution | |
| Primary Goal | Aligns teams, data, and GTM processes. | Ensures specific actions happen in real-time, every time. |
| Function | Manages structure, strategy, and tooling. | Enforces execution speed and accountability. |
| Output | Dashboards, reports, process documentation. | Triggered plays, automated tasks, escalations. |
| Timing | Reviews what happened. | Intervenes before revenue slips. |
| Analogy | The architect who designs the building. | The system that ensures every beam goes up on schedule. |
| The Bottom Line RevOps optimizes the structure of your GTM motion. SpurIQ Revenue Execution optimizes the outcomes of that motion — by sitting directly in the workflow and ensuring no signal falls into the black hole of manual dependency. |
The Execution Metrics That Reveal Your Leakage Rate
Traditional revenue metrics track results, lagging indicators that tell you what happened after the quarter ended. SpurIQ’s execution model introduces a set of leading indicators that surface leakage while there’s still time to stop it.
| Metric | What It Reveals | SpurIQ Execution Lens |
| Signal-to-Action Latency | The average delay between a revenue signal and the first rep action. | Tracked per signal type, per funnel stage, per rep. Benchmarked against best-in-class thresholds. |
| Execution Coverage Rate | % of high-value signals that received an accountable response within SLA. | The primary leakage indicator. Industry average is shockingly low. |
| Slipped Revenue Ratio | % of deals that stalled after showing clear progression signals. | Exposes the mid-funnel wasteland — deals that had momentum but lost execution. |
| Escalation Rate | % of triggered plays that required manager escalation due to rep inaction. | Surfaces systematic execution ownership gaps, not just individual rep performance. |
| Play Conversion Rate | % of orchestrated plays that resulted in the intended outcome. | Enables continuous improvement of orchestration logic over time. |
Implementation: From Execution Gaps to Revenue Execution in Five Steps
SpurIQ’s deployment framework is designed to be operational within weeks, not quarters. The five-step implementation sequence maps directly to the execution gap categories identified in your revenue leakage analysis.
| 01. MAP | Map Revenue Signals Across Every Funnel Stage Identify the top 10 revenue signals across your funnel — from ICP intent spikes at the top to usage drops and champion changes at the bottom. These become the trigger events that SpurIQ’s orchestration engine watches. Most teams find 3–4 signals they hadn’t previously connected to an execution owner. |
| 02. DIAGNOSE | Identify Manual Execution Dependencies Every point in your current process where a human must ‘remember to check’ something is an execution dependency — and a potential leak. Map these failure points explicitly. They become the first targets for SpurIQ orchestration plays. |
| 03. MEASURE | Measure Signal-to-Action Latency by Stage Calculate current average latency for your top-priority signals. This baseline becomes your before number. SpurIQ’s execution reporting tracks latency reduction over time, connecting it directly to revenue outcomes. |
| 04. AUTOMATE | Automate High-Impact Revenue Triggers Build orchestration plays for your top 20% of signals, the ones with the highest revenue impact and the highest latency under your current model. SpurIQ’s play library provides pre-built templates for the most common execution scenarios: intent spike response, deal stagnation recovery, renewal risk intervention, champion change re-engagement. |
| 05. ENFORCE | Assign and Enforce Execution Ownership Every signal in SpurIQ has a designated execution owner — a named individual, not a team. If the owner doesn’t act within the defined SLA, the system escalates automatically. Accountability is built into the architecture, not enforced by management observation. |
Revenue Leakage in 2026: What’s Different Now?
The revenue landscape of 2026 has some specific characteristics that make execution-gap leakage a more urgent problem than it’s ever been. Understanding those characteristics matters for prioritizing where to invest.
Intent data is ubiquitous. Differentiation has shifted to execution.
Five years ago, having access to third-party intent data was a competitive advantage. Today, most serious B2B revenue teams have it. The signal intelligence has leveled. What differentiates high-performing revenue organizations now is what they do with those signals, the speed, consistency, and accountability of the execution that follows.
In 2026, the competitive advantage is Revenue Execution, not signal access.
AI-generated volume has created a response urgency crisis.
AI prospecting tools have dramatically increased outbound volume across the market. Buyers are receiving more outreach than ever before, which means they’re becoming more selective about who they respond to and response time has become a proxy for organizational seriousness. A company that responds to a high-intent signal within an hour signals operational competence. A company that responds in 72 hours signals a broken execution system.
Signal-to-action latency is now a brand signal, not just a conversion variable.
The budget conversation has shifted.
For the last several years, the question revenue leaders brought to CFOs was ‘How do we generate more pipeline?‘ In 2026, with efficiency mandates tightening across most sectors, the question has changed: ‘How do we capture more of the pipeline we already have?‘
Revenue leakage and more specifically, execution-gap leakage is the most direct answer to that question. You don’t need more pipeline. You need to stop bleeding the pipeline you’ve already built.
Stop Diagnosing the Leak. Start Owning the Execution.
Let’s be precise about what the last decade of revenue technology built: the most sophisticated signal detection apparatus in the history of B2B selling. Intent data that identifies buying intent before the buyer raises their hand. Engagement analytics that track every email open, every proposal view, every pricing page visit. CRM platforms that hold more information about your accounts than any rep could hold in their head.
And yet the revenue leakage number, 20 to 30% of potential revenue slipping post-buyer interaction, has not materially improved. In many organizations, it has gotten worse. More signals. More dashboards. More alert emails sitting unread while the buyer moves on.
The uncomfortable conclusion is that the industry built the wrong half of the system. It built the observation layer. It did not build the execution layer.
| The companies that win the next decade will not be the ones with the most data. Insight has become a commodity. The competitive advantage belongs to the organizations with the strongest Execution Ownership. |
SpurIQ is built for exactly this shift. Not as another layer of intelligence on top of intelligence you already can’t act on. As the execution owner — the system that sits between your signal infrastructure and your revenue outcomes and ensures, automatically and accountably, that every meaningful signal produces a coordinated action before the window closes.
Frequently Asked Questions:
What is revenue leakage?
Revenue leakage is the gap between the revenue a business should capture and the revenue it actually collects, caused by execution failures that occur after buyer signals have already been generated. In modern B2B revenue environments, the primary driver of leakage is not billing error or pricing inconsistency, but signal-to-action latency: the delay between a meaningful buyer signal and the accountable action that should follow it.
What’s the difference between revenue leakage and revenue loss?
Revenue loss refers to deals that were never realistic, budget wasn’t there, the ICP wasn’t right, the competitive fit was wrong. Revenue leakage refers specifically to revenue that should have been captured but wasn’t, because execution failed after the signal was already present. It’s a critical distinction, because the solution for leakage is not more pipeline. It’s better execution of the pipeline you have.
How do you calculate revenue leakage?
A revenue leakage analysis begins with mapping signal sources against response actions and measuring the latency and accountability gaps between them. To estimate dollar impact: multiply average deal value by the frequency of high-priority signals, then apply an estimated conversion rate delta between low-latency responses (under 4 hours) and high-latency responses (48+ hours). Even conservative estimates routinely surface seven- or eight-figure leakage numbers at mid-market and enterprise organizations.
What is an example of revenue leakage?
A high-intent prospect opens your proposal three times in 48 hours, visits your pricing page, and forwards the email to two colleagues — all clear buying signals. No automated follow-up fires. The rep is in meetings. By day four, the prospect has signed with a competitor. That is revenue leakage: the signal was present, the execution was absent, and the revenue slipped.
Can revenue leakage be completely eliminated?
No system eliminates all leakage, but a Revenue Execution infrastructure can reduce execution-gap leakage dramatically. Organizations that implement closed-loop signal-to-action orchestration consistently report material improvements in deal velocity, renewal rates, and rep productivity. The goal is not perfection; it’s converting the systematic, preventable leakage that currently flows through execution gaps into captured revenue.