“The most dangerous dashboard is the accurate one that no one acts on. “Your Revenue Dashboard Isn’t Broken. That’s Exactly the Problem.
There is a ghost that haunts the mahogany-row boardrooms of the Fortune 500 during every quarterly business review. Revenue leaders call it the Perfectly Accurate Disaster.
Picture it: the BI team presents gleaming, real-time Tableau or PowerBI dashboards. The data is indisputable. It shows a 15% slippage in mid-market deal velocity, a stale pipeline in the EMEA region, and a rising tide of “no-decision” losses at the final stage. The dashboard is functioning with surgical precision, showing you exactly how, where, and why you are going to miss your year-end number.
Three weeks later, nothing has changed.
This is the central paradox every VP of Sales and CRO is living with right now: revenue dashboards don’t fix revenue. Perfect visibility does not produce corrective action. We have spent the last decade and billions in venture capital perfecting “Revenue Intelligence,” yet according to Gartner, a staggering number of B2B sales organizations still miss quota, not from a lack of data, but from an inability to act on it with speed and accountability.The hard truth most management consultants won’t say out loud: dashboards are diagnostic tools, not corrective systems. A thermometer tells you that you have a fever. It cannot synthesize penicillin. If your organization is relying on a dashboard to fix revenue, you are watching a GPS highlight that you are fifty miles off-route and expecting the screen to turn the steering wheel.
What dashboards were designed to do?
To understand why revenue dashboards don’t fix revenue on their own, you need to understand their lineage. Dashboards were born from Business Intelligence, a discipline designed entirely for reporting, not execution.
The passive ledger vs. the active command center
Historically, the CRM was designed as a system of record: a digital filing cabinet built for auditors and managers. Dashboards were layered on top to summarize that record. This created two fundamentally different operating models that most companies have never consciously chosen between.
- The Passive Ledger model — the default for most B2B organizations, treats revenue as something to be tracked and measured. Data flows in one direction: from system to human. The assumption is that if leadership can see the risk clearly enough, humans will act appropriately.
- The Active Command Center model — the approach that separates high-performing GTM teams, treats data not as the end product but as fuel for an automated execution engine. Data triggers workflows. Workflows have owners. Owners have deadlines. Misses trigger escalations. The system closes the loop.
Most B2B organizations are deeply invested in the first model while desperately wanting the outcomes of the second.
The Three CRM Dashboard Limitations Bleeding Your Pipeline
In advising global GTM leaders, three recurring failure patterns surface with near-universal consistency. Together, they constitute what we call the Visibility Trap: the organizational condition of mistaking data transparency for operational rigor.
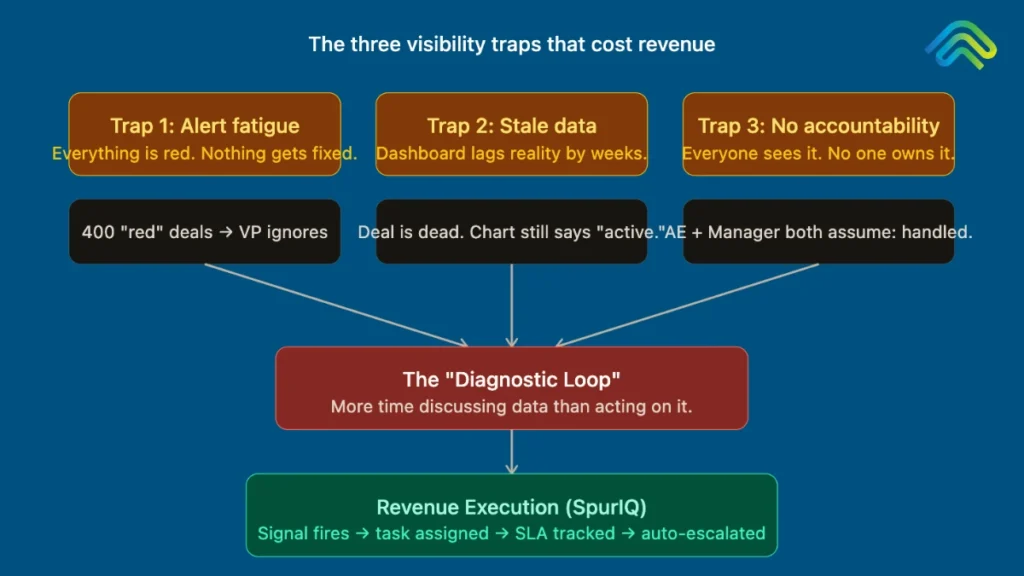
Trap 1: Alert fatigue — the signal-to-noise crisis
When everything is flagged as critical, nothing gets fixed. Modern CRMs are configured to flag a deal “red” if it hasn’t been touched in seven days. In a typical enterprise pipeline, this means a single sales VP is staring at 400 red deals on any given Monday morning.
The result? The VP ignores the dashboard entirely.
High visibility without prioritization creates cognitive paralysis. Without a system that separates noise from a genuine revenue-critical signal, the dashboard becomes background static. The most urgent deals dissolve into the same red gradient as dozens of healthy ones that just need a follow-up email.
The CRM dashboard limitation here is structural: the tool was never built to rank urgency in real time. It reports equally on everything.
Trap 2: Deal decay dashboard — stale data masking real risk
A dashboard is only as accurate as the data entered by the least-motivated rep in your organization. If your team updates opportunities on Friday afternoon before a forecast call, your revenue dashboard is lying to you from Monday through Thursday.
This is the deal decay dashboard problem, by the time a dashboard shows a deal is “stalled,” the deal has actually been dead for two weeks. The champion left the company. The competitor got a reference call. The budget got frozen. The dashboard doesn’t know. It’s still showing “Stage 3: Negotiation.“
McKinsey research indicates that companies automating data capture see material improvements in forecast accuracy, precisely because they eliminate this visibility lag. Relying on manual CRM updates is a structural recipe for revenue leakage in B2B that no reporting layer can solve.
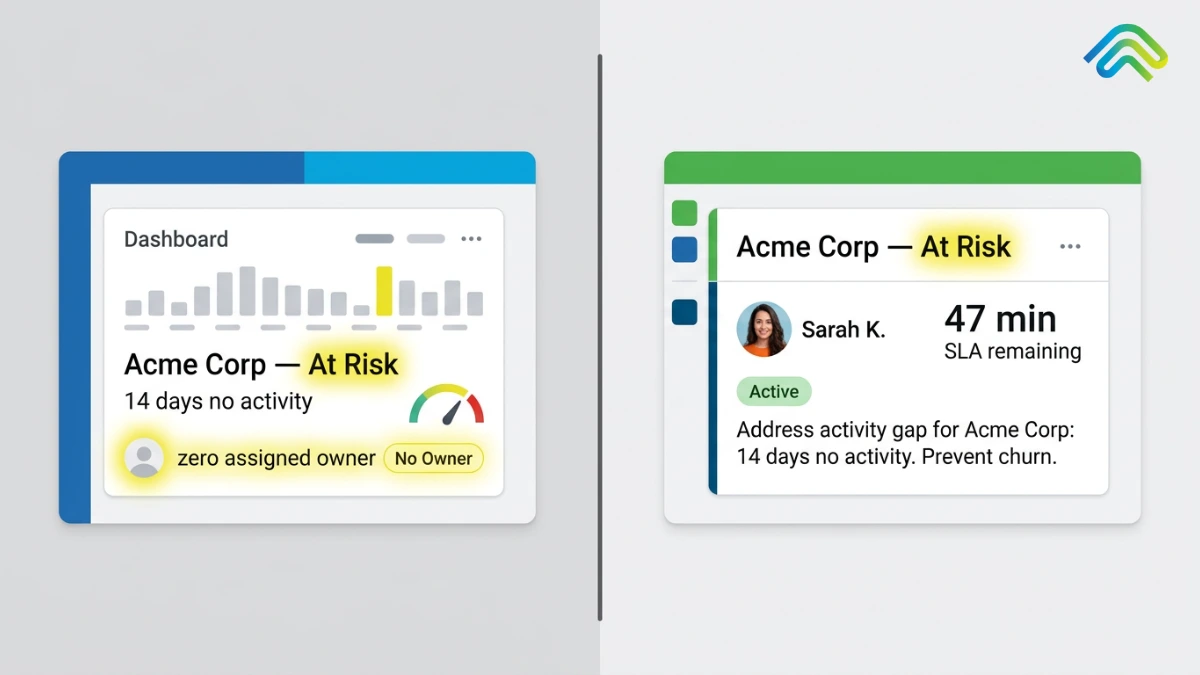
Trap 3: Insight without accountability — the bystander effect
This is the most expensive trap. Because everyone can see the dashboard, there is a psychological assumption that someone is handling it.
A high-value contract is stuck in legal review. It is visible on the “At-Risk Deals” dashboard. The AE thinks the Sales Manager is talking to Legal. The Sales Manager thinks the AE has it under control. The deal slips to next quarter. Both professionals are competent. The system failed them.
Visibility does not assign ownership. A dashboard is a public square. An execution system is a direct assignment with a named owner, a deadline, and an escalation path if nothing happens.
Why More Dashboards Make Revenue Leakage in B2B Worse, Not Better?
When revenue growth slows, the instinct of enterprise leadership is to buy another tool, a “Single Pane of Glass” to unite all other panes of glass. This instinct is precisely wrong.
Every new dashboard adds a layer of friction:
- Tool fatigue: Sales reps are now expected to monitor the CRM, Gong, a relationship-mapping tool, and a revenue intelligence dashboard, all before making a single call.
- The Daily Digest Graveyard: Automated “Your Daily Revenue Summary” emails are almost universally deleted, because they provide information without a clear, immediate path to action.
According to Deloitte’s digital transformation research, the most successful revenue organizations are not the ones with the most tools, they are the ones with the highest Signal-to-Action Ratio. If you increase visibility (signals) without increasing capacity to act, you are not solving your revenue problem. You are increasing the stress level of your management team while the pipeline continues to leak.
Revenue Visibility vs. Execution: The Distinction That Actually Matters
To close the gap between seeing a problem and fixing it, GTM leaders must recognize that they are operating two fundamentally different categories of technology and most are only investing in one.
| Feature | Revenue Visibility (Dashboards) | Revenue Execution System (SpurIQ) |
| Primary Goal | Information & Reporting | Action & Resolution |
| User Experience | Passive Observation (Reading charts) | Active Participation (Triggered tasks) |
| Data Flow | One-way (System $\rightarrow$ Human) | Bi-directional (Signal $\rightarrow$ Action $\rightarrow$ Result) |
| Accountability | Group-based (The team sees the risk) | Individual-level (Assigned at the signal) |
| Outcome | “We know why we missed.” | “We hit the number by fixing the leaks.” |
Revenue visibility tells you what is wrong by aggregating historical and current data.
Revenue execution fixes it by converting those signals into mandatory, automated, and accountable workflows.
This is not a philosophical distinction. It is the operational gap where B2B revenue leakage lives and where the majority of organizations have never invested a dollar.
What a Revenue Execution system actually does?
A Revenue Execution system represents a paradigm shift in how a GTM organization thinks about its technology. It does not replace the dashboard. It assumes the dashboard is already working and focuses entirely on what happens after the signal fires.
From passive alert to active workflow trigger
In a standard dashboard, a “Stalled Deal” is a red dot. In a Revenue Execution system, a “Stalled Deal” is a trigger.
If a champion hasn’t responded to a mutual action plan within 72 hours, the system does not just flag it. It automatically generates a Slack notification to the AE, cc’s the Sales Engineer, and provides a pre-written follow-up template tailored to the specific deal stage and roadblock. The rep does not need to notice anything. The system acts on their behalf.
Assignment at the signal level — eliminating the bystander effect
Revenue Execution eliminates the bystander effect by assigning every critical signal to a specific, named human owner. Instead of a manager looking at a dashboard and asking “who’s working on this?”, the system has already assigned the task and is actively tracking Time-to-Resolution (TTR).
This single change, moving from group visibility to individual accountability, is responsible for the majority of the pipeline recovery SpurIQ customers see in their first quarter.
Deal IQ — automating beyond simple “if-this-then-that” logic
Revenue Execution moves beyond simple workflow rules. Through Deal IQ, the system understands the nuance of execution.
Example: A contract has been sent via DocuSign but hasn’t been viewed in 48 hours. The execution system recognizes this as a frictional risk — not a deal death, but a friction point requiring a specific intervention. It automatically triggers a sequence where the Executive Sponsor is alerted to reach out to their counterpart, bypassing the manual check-in process that typically takes days to initiate.
This is not a dashboard alert. This is a system that acts.
How to audit your own visibility-to-execution gap?
Before buying anything, CXOs should run a ruthless internal audit. Ask your GTM leaders these three diagnostic questions:
Question 1: What critical revenue signals currently live only inside a dashboard? If a top-tier account hasn’t had a meeting in 30 days, is that a chart — or does it trigger an automatic intervention with a named owner and a deadline?
Question 2: Who is specifically accountable when a negative signal fires? If the answer is “the whole team” or “whoever sees it first,” then no one is accountable. Revenue signals need owners the way deals need owners.
Question 3: What happens if no one acts on a dashboard alert? In most companies, the answer is “nothing, until end of month.” In a high-execution company, the system escalates automatically to the next level of leadership — or reassigns the signal to a rep who will act on it.
If your honest answers reveal that your signals primarily live in dashboards and die there, you are in the Diagnostic Loop. The exit is not another dashboard.
The Revenue Execution Maturity Model
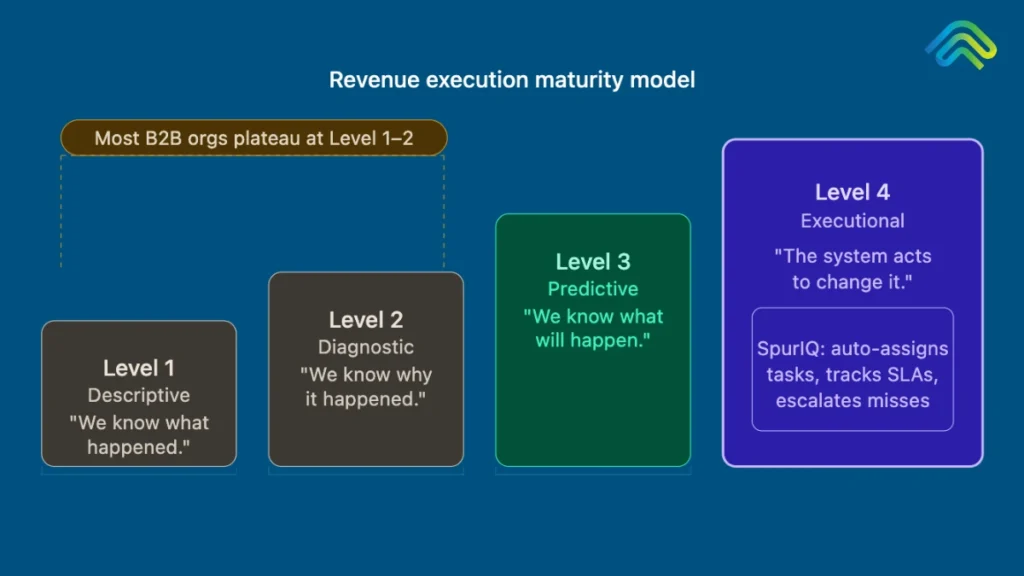
The path from passive visibility to active execution follows a predictable arc. Understanding where your organization sits is the first step to closing the revenue leakage in B2B that is costing you every quarter.
Level 1 — Descriptive (The Dashboard Phase) “We know what happened.” The organization has reporting. It can tell you what the pipeline looked like last quarter, last week, and yesterday. Most enterprise companies are here. Many never leave.
Level 2 — Diagnostic (The Intelligence Phase) “We know why it happened.” The organization can connect outcomes to causes — why deals slipped, where velocity dropped, which rep behaviors predict win rates. Tools like Gong and Clari live here.
Level 3 — Predictive “We know what will happen.” Forecasting models, deal risk scores, and propensity models surface where things are likely to break before they do. This is where most of the recent RevTech investment has flowed.
Level 4 — Executional (The SpurIQ Phase) “The system automatically acts to change the outcome.” Signals trigger workflows. Workflows have owners. Owners have SLAs. Missed SLAs escalate automatically. The gap between knowing and doing collapses to minutes — not weeks.
Most B2B organizations have invested heavily in Levels 2 and 3. They are missing the layer that converts that investment into revenue: Level 4.
What are the Key Takeaways for Leaders?
Stop investing in more glass. You do not need a “single pane of glass.” You need a single path to action.
Measure Signal-to-Action Latency. Track the elapsed time between a dashboard identifying a problem and a human or system resolving it. This single metric will tell you more about your execution health than any pipeline report.
Automate accountability. Use technology to assign ownership of data signals — not just high-level goals. Ownership at the signal level is what prevents the bystander effect from compounding across your entire pipeline.
Distinguish intelligence from execution. Gong gives you the “what.” Clari gives you the “why.” You need an execution layer to deliver the “how” and “when” — automatically, at scale, without depending on a human to notice the right thing at the right moment.
Recognize that revenue dashboards don’t fix revenue, execution does. The dashboard is not the destination. It is the starting point. The companies that win the next decade of B2B revenue competition will not be the ones with the most sophisticated pipeline visibility. They will be the ones that built the shortest path from signal to action.
Conclusion: The Dashboard Sees Everything. Your Revenue System Does Nothing.
The era of the “Passive CRO” who manages via a dashboard is coming to an end. In an increasingly volatile market, the competitive advantage belongs to the organizations that can close the gap between insight and action.
The ROI of a Revenue Execution system isn’t measured in “better charts”; it is measured in the recapture of leaked revenue. By converting visibility into mandatory workflows, you ensure that no deal dies in the darkness of an unread dashboard.
The Dashboard Is Not the Destination
There’s a maturity arc in every revenue organization’s relationship with data. First, you fight for visibility – you want to see the pipeline clearly, understand deal health, and stop being surprised at quarter-end. Dashboards are the answer to that problem. They solve it well. The mistake is stopping there.
The next frontier is not better dashboards. It is not more granular data. It is the infrastructure that converts the signal into action – automatically, at scale, without depending on a human to notice the right thing at the right moment.
The companies that win the next decade of B2B revenue competition will not be the ones with the most sophisticated pipeline visibility. They will be the ones that built the shortest path from signal to action – and closed the gap between knowing and doing.
Your dashboard is telling you exactly what’s wrong. The question is whether your revenue system is designed to fix it.
FAQs:
Why don’t sales dashboards improve revenue?
Dashboards are inherently passive. They provide information but lack the mechanism to enforce action. Without a linked execution system, a dashboard is merely a reporting tool that identifies failure after it has already begun to happen.
What is the difference between revenue visibility and revenue execution?
Visibility is the state of having data (knowing there is a problem). Execution is the process of acting on that data (fixing the problem). Revenue Execution systems automate the transition from signal to action.
What is deal decay and how do dashboards miss it?
Deal decay is the slow loss of momentum in an opportunity. Dashboards often miss it because they rely on “static” fields like “Stage” or “Close Date,” whereas deal decay is found in “dynamic” signals like decreasing email frequency or unresponded-to documents – signals that execution systems are built to catch and act upon instantly.
Why do accurate dashboards still fail to improve revenue?
Because dashboards are diagnostic, not prescriptive. They identify where the problem is, a stalled deal, a dormant account, but assign no owner, trigger no workflow, and set no deadline. Accuracy without accountability is just a better-looking failure.
What does “Signal-to-Action Ratio” mean for GTM teams?
The Signal-to-Action Ratio measures how many of your detected revenue signals actually result in a timely, deliberate action versus expiring unacknowledged. Deloitte’s research found that top-performing firms prioritize increasing this ratio over simply adding more visibility tools, because more signals without more execution capacity only increases management stress.
What is “Visibility Lag” in B2B sales forecasting?
Visibility Lag is the gap between when a deal actually changes state (going cold, losing a champion, stalling in legal) and when that change becomes visible on the dashboard, caused by manual CRM updates that only happen before forecast calls. McKinsey research links automated data capture to significantly higher forecast accuracy, precisely because it eliminates this lag.
Can Gong, Clari, or Salesforce replace a Revenue Execution platform?
No. Tools like Gong and Clari provide the “what” and “why”, conversation intelligence and forecasting. Salesforce stores the record. None of these are built to close the loop by automating mandatory workflows when a signal fires. A Revenue Execution platform like SpurIQ is the layer that sits on top of these tools and forces action to happen.
What are the 4 levels of Revenue Execution Maturity?
Level 1 is Descriptive, the organization knows what happened. Level 2 is Diagnostic, it understands why. Level 3 is Predictive, it forecasts what will happen. Level 4 is Executional, the system automatically acts to change the outcome before revenue leaks. Most B2B organizations plateau at Level 2 despite investing in Level 3 tools.
What is the “Bystander Effect” in sales pipeline management?
In social psychology, the bystander effect means that the more people who witness a problem, the less likely any individual is to act. In pipeline management, when a critical deal risk is visible to the entire team on a shared dashboard, everyone assumes someone else is handling it, resulting in no one acting. At SpurIQ, Revenue Execution systems eliminate this by converting visibility into direct, named task assignment.
What is “Signal-to-Action Latency” and how do you measure it?
Signal-to-Action Latency is the elapsed time between a dashboard or system identifying a revenue risk (a stalled deal, an unopened contract, a dropped champion) and a human or automated system taking a corrective action. It is arguably the single most telling metric of GTM operational efficiency and most companies have never measured it.